Finance Dashboard with Excel
This interactive dashboard project in Excel provides a visually intuitive and comprehensive overview of key metrics and performance indicators related to the bank's loan portfolio.
A dedicated and skilled Data Analyst
making informed decisions from extracted insights.
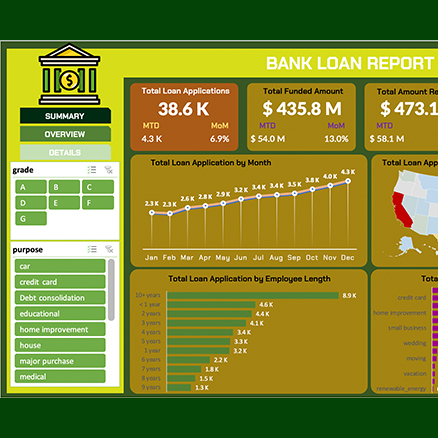
This interactive dashboard project in Excel provides a visually intuitive and comprehensive overview of key metrics and performance indicators related to the bank's loan portfolio.
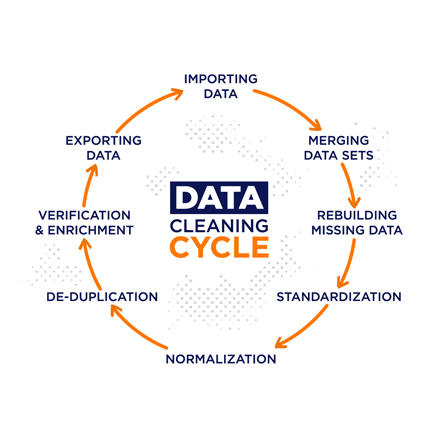
This project is completed using SQL queries and scripts, data cleaning tasks include handling missing values, correcting inaccuracies, normalizing data formats, and ensuring data integrity for subsequent analysis.

This project involves the application of data analysis and machine learning techniques to categorize a customer dataset into distinct groups based on shared characteristics.
My work confidence is based on possessing a versatile skill set that combines technical, analytical, and communication abilities.
Competent in programming languages such as SQL, Python or DAX to manipulate and analyze data efficiently.
Familiar with database systems and the ability to query databases using SQL for data extraction and manipulation.
Creative problem-solving skills to tackle complex data challenges and provide innovative solutions.
Building clear and compelling visualizations using tools like Matplotlib, Seaborn, or PowerBI to communicate complex findings to non-technical stakeholders.
Application of fundamental machine learning concepts and techniques, allowing for predictive modelling and pattern recognition.
Effective communicator of complex findings to both technical and non-technical audiences, facilitating data-driven decision-making.
Let's turn your raw data into valuable insights, promote informed business decisions and contribute to the overall success of your business.
.png)